QARTOD Examples
Notebook Setup
First, I include some modules that make it easier to write notebooks. It just wraps some plotting stuff for me so I don’t have to paste it into every notebook.
import sys
sys.path.append('/Users/lcampbell/Notebooks/toolkit')
%matplotlib inline
from oceansmap import plotting
from oceansmap import opendap
/Users/lcampbell/.virtualenvs/work/lib/python2.7/site-packages/numexpr/cpuinfo.py:76: UserWarning: [Errno 2] No such file or directory
  stacklevel=stacklevel + 1):
from netCDF4 import Dataset, num2date
from datetime import datetime
import numpy as np
url = 'http://sos.maracoos.org/stable/dodsC/hrecos/HRWSTPTH/HRWSTPTH_2016-08-17.nc'
nc = Dataset(url)
print opendap.num2date(nc.variables['time'][-1], nc.variables['time'].units).isoformat()
print ""
for variable in opendap.get_geophysical_variables(nc):
    pretty_name = plotting.pretty_name(nc, variable)
    print '{:60}: {} {}'.format(pretty_name, nc.variables[variable][-1].item(), nc.variables[variable].units)
2016-08-18T03:30:00.000006

Mass Concentration Of Oxygen In Sea Water (kg m-3)          : 0.00596999982372 kg m-3
Sea Water Ph Reported On Total Scale (pH)                   : 7.57999992371 pH
Water Surface Height Above Reference Datum (m)              : 0.0 m
Sea Water Turbidity (NTU)                                   : 28.5 NTU
Sea Water Electrical Conductivity (S m-1)                   : 0.319599986076 S m-1
Sea Water Temperature (degrees_C)                           : 28.0900001526 degrees_C
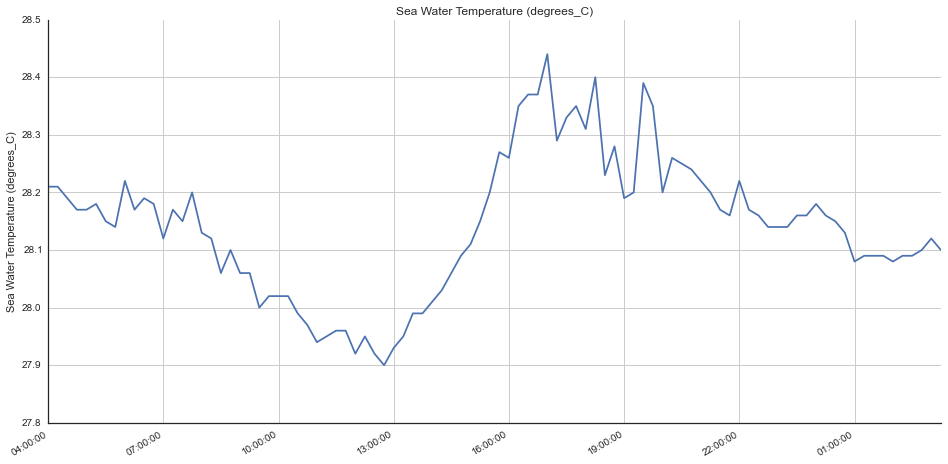
plotting.easy_plot(nc, 'sea_water_temperature', datetime(2016, 8, 17, 0), None)
Let’s do some QC!
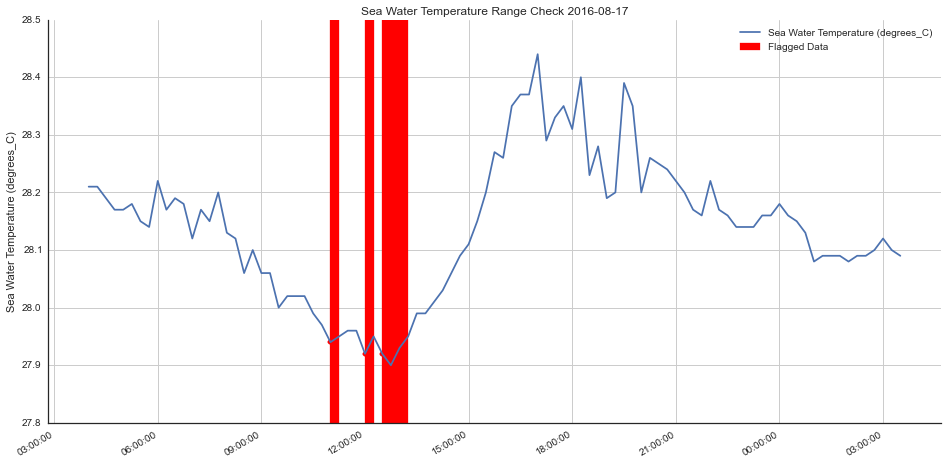
Range Check
from ioos_qartod.qc_tests import qc
sensor_range = (0, 100)
user_range   = (27.95, 30)
help(qc.range_check)
Help on function range_check in module ioos_qartod.qc_tests.qc:

range_check(arr, sensor_span, user_span=None)
    Given a 2-tuple of sensor minimum/maximum values, flag data outside of
    range as bad data.  Optionally also flag data which falls outside of a user
    defined range.

    :param arr: An array of data
    :param sensor_span: A 2-tuple consisting of the sensor limits.  Data
                        exceeding this threshold will be flagged as bad
    :param user_span: An optional 2-tuple consisting of the expected data bounds. Data outside of these bounds but within sensor span will
                      be flagged as suspect.  If the parameter is not present or is None, then onlyh the sensor_span will be considered and no data can be flagged as suspect.
qc_flags = qc.range_check(nc.variables['sea_water_temperature'][:], sensor_range, user_range)
x = nc.variables['time'][:]
x = num2date(x, nc.variables['time'].units)
y = nc.variables['sea_water_temperature'][:]
ylabel = plotting.pretty_name(nc, 'sea_water_temperature')
title = "Sea Water Temperature Range Check 2016-08-17"
flagged = np.where(qc_flags != 1)[0]
plotting.make_qc_plot(x, y, flagged, ylabel=ylabel, title=title)
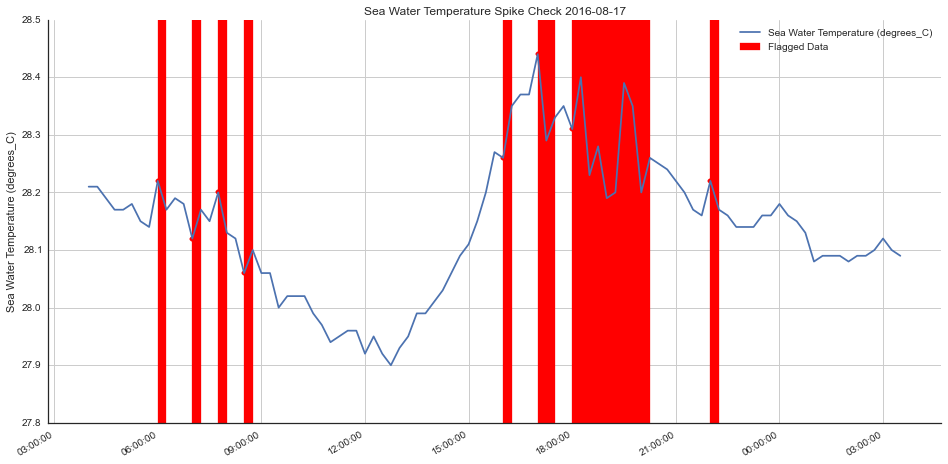
Spike Check
low_thresh, high_thresh = 0.05, 0.5
help(qc.spike_check)
Help on function spike_check in module ioos_qartod.qc_tests.qc:

spike_check(arr, low_thresh, high_thresh, prev_qc=None)
    Determine if there is a spike at data point n-1 by subtracting
    the midpoint of n and n-2 and taking the absolute value of this
    quantity, seeing if it exceeds a a low or high threshold.
    Values which do not exceed either threshold are flagged good,
    values which exceed the low threshold are flagged suspect,
    and values which exceed the high threshold are flagged bad.

    The flag is set at point n-1.

    :param arr: The input array of values
    :param low_thresh: The low value threshold
    :param high_threshold: The high threshold value
    :param prev_qc: An array of any previous QC values which were applied.  The first element is assumed to correspond to the position of the first element of arr
qc_flags = qc.spike_check(nc.variables['sea_water_temperature'][:], low_thresh, high_thresh)
title = "Sea Water Temperature Spike Check 2016-08-17"
flagged = np.where((qc_flags == 3) | (qc_flags == 4))[0]
plotting.make_qc_plot(x, y, flagged, ylabel=ylabel, title=title)
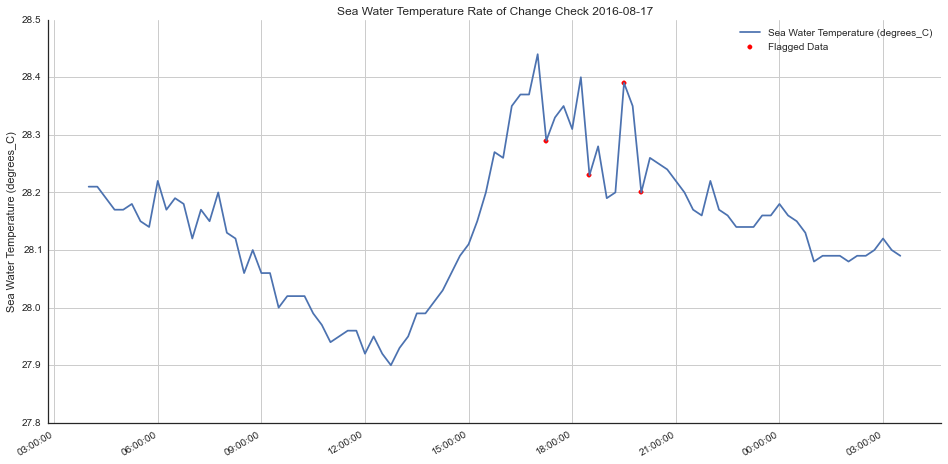
Rate of Change
help(qc.rate_of_change_check)
Help on function rate_of_change_check in module ioos_qartod.qc_tests.qc:

rate_of_change_check(times, arr, thresh_val, prev_qc=None)
    Checks the first order difference of a series of values to see if
    there are any values exceeding a threshold.  These are then marked as
    suspect.  It is up to the test operator to determine an appropriate
    threshold value for the absolute difference not to exceed.  Threshold may
    be expressed as a python quantities unit.  For example:
    import quantities as pq
      # more code ...
      # threshold of 2.5 per hour
      threshold = 2.5 / pq.hour
      # run the test with the new threshold
      results = rate_of_change_check(times, arr, threshold, old_qc)``

    Defaults to a rate expressed in terms of seconds if not specified.

    :param times: An array of times
    :param arr: An array of observed values
    :thresh_val: Either a float value representing a rate of change over time
                 or a quantities object represneting a value's rate of change over time
import quantities as pq
threshold = 0.45 / pq.hour # 1 °C per hour
dates = np.array(num2date(nc.variables['time'][:], nc.variables['time'].units), dtype='datetime64[ms]')
qc_flags = qc.rate_of_change_check(dates, y, threshold)
title = "Sea Water Temperature Rate of Change Check 2016-08-17"
flagged = np.where((qc_flags == 3) | (qc_flags == 4))[0]
plotting.make_qc_plot(x, y, flagged, highlight=False, ylabel=ylabel, title=title)